Wisconsin pulled the upset of Kentucky, which makes the final of the 2015 NCAA Tournament an interesting match-up between two very evenly matched teams. Throughout the tournament, all predictions indicated that Wisconsin was (a very distant) second behind Kentucky with respect to probabilities of winning the tournament.
Based on the latest (and final) model predictions, Wisconsin is a slight favorite over Duke in a game that is essentially a toss-up:
| Team | Seed | Region | Prob of Championship | B-T Effect |
|---|---|---|---|---|
| Wisconsin | 1 | West | 0.5326 | 5.461 |
| Duke | 1 | South | 0.4674 | 5.294 |
Overall Model Results
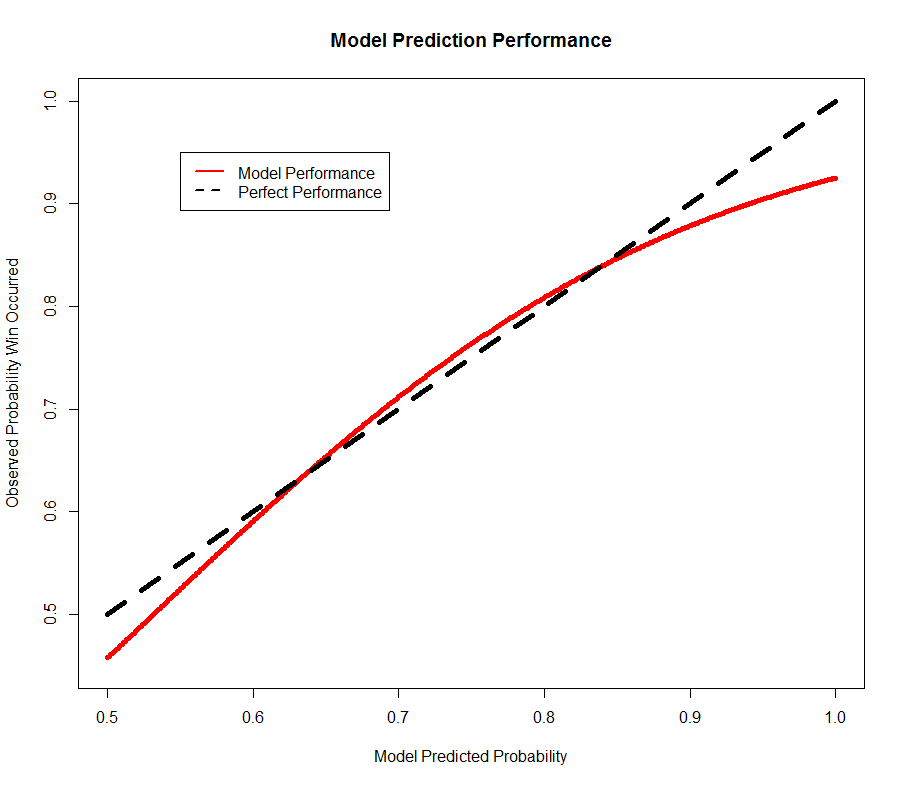
Although the Bradley-Terry model was accurate at picking the winner for only 71.2% of the games, a deeper analysis shows that the model predictions were well calibrated but that the model itself lacked the prediction power to be more informative. In the figure below, the X-axis represents the model-predicted probability a team would win and the Y-axis represents the expected true proportion of wins for any given probability. The solid red line is the model the dashed black line is where a perfectly calibrated model would fall.
The graph shows that the model was, for the most part, well calibrated in its assessment of probability in that the red line is nearly on top of the black line. Where the model missed was with predicted probabilities close to .5 and close to 1. In these cases, the model was slightly over-confident in its assessment of probability.
What does that mean for the final game (with a model-predicted probability of winning of .53)? Based on the curve in the graph, the result is likely closer to a 50-50 game.
What this says to me is that a better model is needed…and one will be forthcoming in time for the next round of predictions…to be continued…

